
Excel is the cockroach of software, everyone predicts its death, yet here we are in 2024 watching TikTok data influencers teach VLOOKUP to Gen Z while Fortune 500 CEOs still demand their quarterly reports in .xlsx format. Data scientists have their Python notebooks, visualization artists have their Tableau dashboards, and machine learning engineers have their Jupyter environments. But when the rubber meets the road, when decisions need to be made and budgets need to be approved, everyone comes crawling back to those familiar rows and columns.
This isn’t a story about technological stagnation or corporate stubbornness. Excel hasn’t just survived the data revolution; it’s thrived by evolving into something more valuable than any specialized tool: the emotional comfort food of business intelligence, the digital duct tape holding together more of the economy than we want to admit, and the universal translator between human intuition and data reality.
Excel: The Training Wheels of Data (And That’s Not an Insult)
Let’s get one thing straight: calling Excel the “training wheels of data analysis” isn’t an insult, it’s recognition of brilliant design. Most people don’t need to become data scientists; they just need to stop being afraid of their own spreadsheets. And Excel does something that no other tool has managed to replicate: it makes data feel approachable.
Think about it. When someone opens Excel for the first time, they see a grid. Not code. Not a command line. Not abstract syntax that requires three Stack Overflow tabs to decipher. Just a simple, intuitive table that mirrors how humans naturally organize information. Rows and columns aren’t revolutionary concepts, they’re how we’ve been thinking about data since we started making lists on papyrus.
Excel democratizes data literacy by introducing fundamental concepts without the cognitive overhead. Structured data suddenly makes sense when you can see it laid out like a table. Formulas read like sentences instead of ancient runes. Charts emerge from data with a few clicks instead of requiring a PhD in visualization theory. It’s the difference between learning to drive in a parking lot versus being thrown onto the interstate during rush hour.
The beautiful thing about this approach is the natural graduation path it creates. People who master Excel’s logical thinking, understanding cell references, building formulas, organizing data, develop the mental models that make transitioning to SQL, Python, or Power BI feel like natural evolution rather than starting from scratch. Excel graduates don’t just learn tools; they learn to think analytically. That’s a feature, not a bug.
Digital Duct Tape: Excel’s Swiss Army Knife Supremacy
Here’s the dirty secret that the big data evangelists don’t want to admit: not every problem needs a Kubernetes cluster to solve. In fact, most business problems are small-to-medium scale and need solutions yesterday, not after a three-month implementation cycle and a dedicated data engineering team.
Excel thrives in this space because it’s the ultimate pragmatic tool. Need a financial model for your startup pitch? Excel can have you building DCF models faster than you can say “venture capital.” Project timeline getting out of hand? Throw together a Gantt chart that actually makes sense to humans instead of requiring specialized project management software that costs more than most people’s cars.
But the real magic happens in what I call the “Karen in Accounting Effect.” Every organization has that one person who somehow became the unofficial data wizard through Excel mastery. They weren’t hired as analysts or trained as data scientists, but they can make pivot tables dance and VLOOKUP sing. These accidental experts are the hidden backbone of business intelligence, solving real problems with creative spreadsheet solutions that would make computer science purists weep but executives applaud.
Excel’s versatility isn’t about being the best at everything, t’s about being good enough at everything when time and resources are limited. Sometimes “good enough fast” beats “perfect eventually,” especially when your CEO needs an answer before the board meeting starts in two hours.
The Emotional Comfort Food of the C-Suite
Let’s talk about the elephant in the conference room: Excel isn’t just what executives know, t’s what makes them feel powerful and in control of their data. This goes way deeper than simple familiarity or generational preferences. Excel provides something that beautiful Tableau dashboards and sophisticated R analyses simply can’t: a tangible, interactive relationship with information.
When a CEO opens an Excel file, they’re not just viewing data, they’re touching it. They can change an assumption in cell B4 and watch the entire financial model recalculate in real time. They can sort, filter, and manipulate information with immediate visual feedback. It’s the difference between being a passenger in a car versus being behind the wheel. The destination might be the same, but the psychological experience is completely different.
Current business leadership didn’t grow up with Python or R, they grew up with spreadsheets that responded to their input and made them feel capable rather than dependent on technical specialists. When you hand an executive a static dashboard, you’re essentially saying “trust us, the smart people made this for you.” When you hand them an Excel file, you’re saying “here are the tools, figure it out yourself.” That autonomy matters more than we give it credit for.
This explains the persistent “final mile problem” in data analysis. You can run the most sophisticated machine learning algorithms in Python, create beautiful visualizations in Tableau, and build elegant data pipelines in the cloud. But when it comes time to present findings to stakeholders, everything gets exported to Excel. Because at the end of the day, decision-makers want to poke at the numbers themselves, run their own what-if scenarios, and feel that tactile connection to the information driving their choices.
The Cultural Anthropology of Spreadsheet Society
Excel isn’t just software, it’s a social construct that has woven itself into the fabric of how business gets done. It’s become the unofficial operating system of small business America, the digital lingua franca that spans industries, departments, and technical skill levels.
Consider the shared Google Sheet phenomenon: modern collaboration distilled into rows and columns. Wedding planning, fantasy football leagues, volunteer schedules, startup financial models—they all live in spreadsheets because Excel created a universal language for organizing shared information. It’s social media for people who actually need to get things done together.
This cultural adoption creates something beautiful: accidental expertise. People who never intended to become data-literate develop sophisticated analytical skills through necessity and Excel’s gentle learning curve. The marketing coordinator who builds complex campaign tracking spreadsheets. The small business owner who creates inventory management systems. The nonprofit volunteer who turns donation data into donor insights. These aren’t trained analysts—they’re regular humans who discovered they could bend data to their will through the familiar interface of rows and columns.
Excel files have become the hidden infrastructure of the economy. Church budgets, food truck inventory, contractor estimates, wedding guest lists—the mundane but essential data that keeps society functioning lives in spreadsheets. We’ve built a civilization on .xlsx files, and that’s both hilarious and profound.
Microsoft’s Glow-Up Game: Not Your Millennial Manager’s Excel
While everyone was looking at shiny new data tools and predicting Excel’s demise, Microsoft was quietly executing one of the most successful product evolution strategies in software history. They kept the familiar interface that people loved while completely rebuilding the engine underneath. It’s like putting a Tesla motor in a 1967 Mustang-classic looks, modern performance.
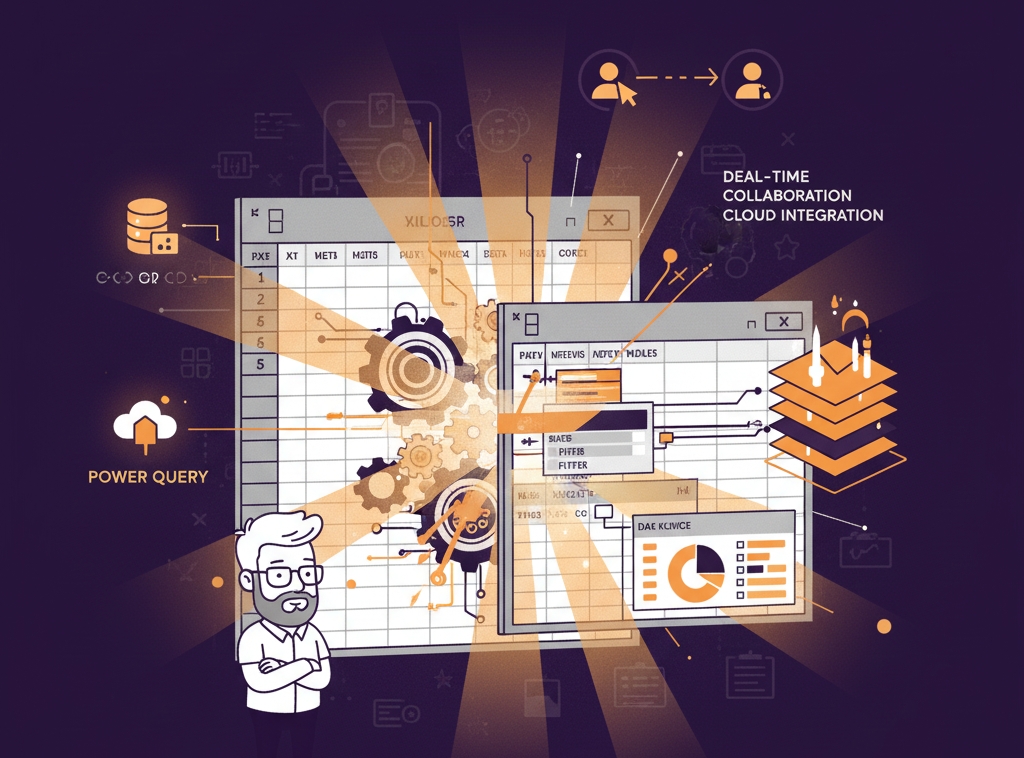
Power Query alone represents a paradigm shift that most people don’t fully appreciate. What used to require expensive ETL tools or specialized database knowledge now happens through a friendly point-and-click interface. Data transformation, cleaning, and connection, the boring but essential plumbing of analytics, became accessible to anyone who could use Excel. This isn’t just a feature update; it’s democratization of data engineering.
Power Pivot and DAX brought database-like functionality to spreadsheets without forcing users to learn SQL. Dynamic arrays and functions like XLOOKUP finally fixed decades-old complaints about Excel’s limitations. Real-time collaboration through Office 365 made spreadsheets as social as they needed to be for modern work.
The genius of this approach is stealth modernization. Users didn’t have to learn entirely new software or abandon their existing skills. They could stay in their comfort zone while gaining access to capabilities that rival specialized tools. It’s like upgrading your car’s engine while keeping the same steering wheel and dashboard, familiar on the surface, revolutionary underneath.
Yes, Excel Will Break (And That’s Fine, Actually)
Let’s be honest about Excel’s limitations because pretending they don’t exist undermines credibility. Excel will absolutely choke on your 50GB dataset, and your nested IF statements that look like ancient hieroglyphics aren’t best practice. When your spreadsheet starts sounding like a jet engine taking off, it’s time to admit you’ve pushed beyond Excel’s sweet spot.
The version control nightmare is real. We’ve all lived through the “Final_Final_ACTUAL_Final_v3.xlsx” chaos where nobody knows which version contains the real numbers. Excel amplifies human error in spectacular ways—one wrong formula can cascade through interconnected cells like a digital avalanche, destroying carefully built models in seconds.
Performance becomes painful with genuinely large datasets. Reproducibility and automation remain clunky compared to code-based approaches. Complex statistical analysis requires mental gymnastics that more specialized tools handle elegantly.
But here’s the thing: acknowledging these limitations isn’t an indictment of Excel—it’s recognition that different problems require different tools. The right tool philosophy matters more than tool evangelism. Most business problems don’t need industrial-strength solutions. They need quick, flexible, human-friendly approaches to everyday challenges.
Knowing Excel’s limits is as valuable as knowing its strengths. The goal isn’t to make Excel do everything; it’s to understand when Excel is the right choice and when to hand off to specialized tools. A good craftsperson doesn’t use a hammer for every task, but they also don’t throw away their hammer when they buy a power drill.

Excel’s enduring success isn’t about technological superiority—it’s about understanding human nature and business reality. In a world increasingly dominated by specialized tools and artificial intelligence, Excel thrives because it makes people feel capable rather than intimidated. It bridges the gap between human intuition and data reality in ways that more sophisticated tools often miss.
The partnership model is Excel’s future, not replacement by shinier alternatives. Python, R, Tableau, and Power BI all have their place in the modern data ecosystem. But Excel serves as the universal translator, the common ground where technical analysts and business stakeholders can meet and actually understand each other.
Excel democratizes data literacy, provides emotional comfort to decision-makers, evolves with technological advances, and maintains its role as the digital duct tape holding together countless business processes. It’s simultaneously the entry point for data beginners and the final presentation layer for advanced analyses.
The most powerful technology isn’t always the most sophisticated, sometimes it’s the one that meets people where they are and helps them get where they need to go. Excel has mastered this balance for over three decades, adapting and evolving while maintaining its core promise: making data accessible to humans who have actual work to do.
In an industry obsessed with disruption and replacement, Excel represents something different: sustainable evolution. It’s not just surviving the data revolution, it’s hosting the after-party, making sure everyone gets home safely, and cleaning up the mess in the morning. Long live the cockroach. We’re probably going to need it.
Leave a Reply
You must be logged in to post a comment.